Earnings Per Share (EPS) is one of the most important financial metrics used by investors to assess a company’s profitability. It tells you how much profit a company has generated for each outstanding share of its stock.
Formula of EPS:
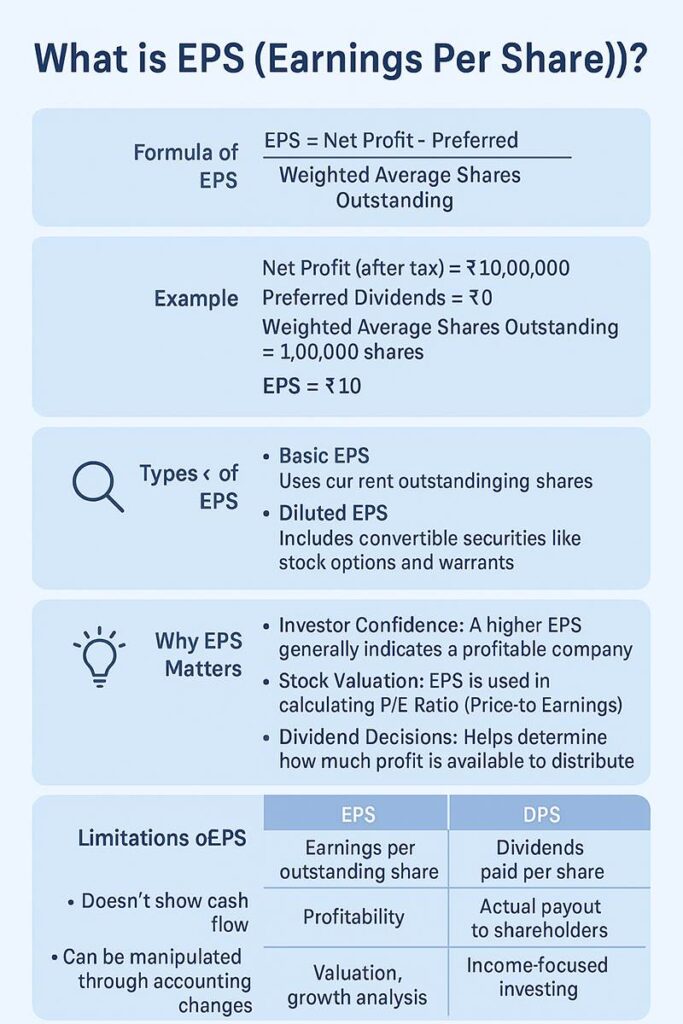
EPS=Net Profit−Preferred DividendsWeighted Average Shares Outstanding\text{EPS} = \frac{\text{Net Profit} – \text{Preferred Dividends}}{\text{Weighted Average Shares Outstanding}}EPS=Weighted Average Shares OutstandingNet Profit−Preferred Dividends
Example:
Let’s say:
Net Profit (after tax) = ₹10,00,000
Preferred Dividends = ₹0
Weighted Average Shares Outstanding = 1,00,000 shares
This means the company generated ₹10 profit per share.
Types of EPS:
Basic EPS: Uses the current outstanding shares.
Diluted EPS: Includes convertible securities like stock options and warrants, giving a more conservative view.
Why EPS Matters?
Investor Confidence: A higher EPS generally indicates a profitable company.
Stock Valuation: EPS is used in calculating P/E Ratio (Price-to-Earnings), another key valuation metric.
Dividend Decisions: Helps determine how much profit is available to distribute.
EPS vs. Dividend per Share (DPS)
Metric
EPS
DPS
Definition
Earnings per outstanding share
Dividends paid per share
Indicates
Profitability
Actual payout to shareholders
Used for
Valuation, growth analysis
Income-focused investing
Limitations of EPS
Doesn’t show cash flow
Can be manipulated through accounting changes
Doesn’t reflect debt or capital structure
Final Thoughts
EPS is a fundamental metric to evaluate a company’s earning strength on a per-share basis. However, it should not be used in isolation. Combine EPS analysis with revenue trends, margins, debt levels, and industry benchmarks for a complete picture.