When new traders step into the world of financial markets, one of the first concepts they encounter is technical analysis. But what exactly is technical analysis, and why do so many traders around the world rely on it?
In this article, we’ll explain the basics of technical analysis, how it differs from fundamental analysis, and how traders use it to make smarter decisions in the stock, forex, and crypto markets.
What is Technical Analysis?
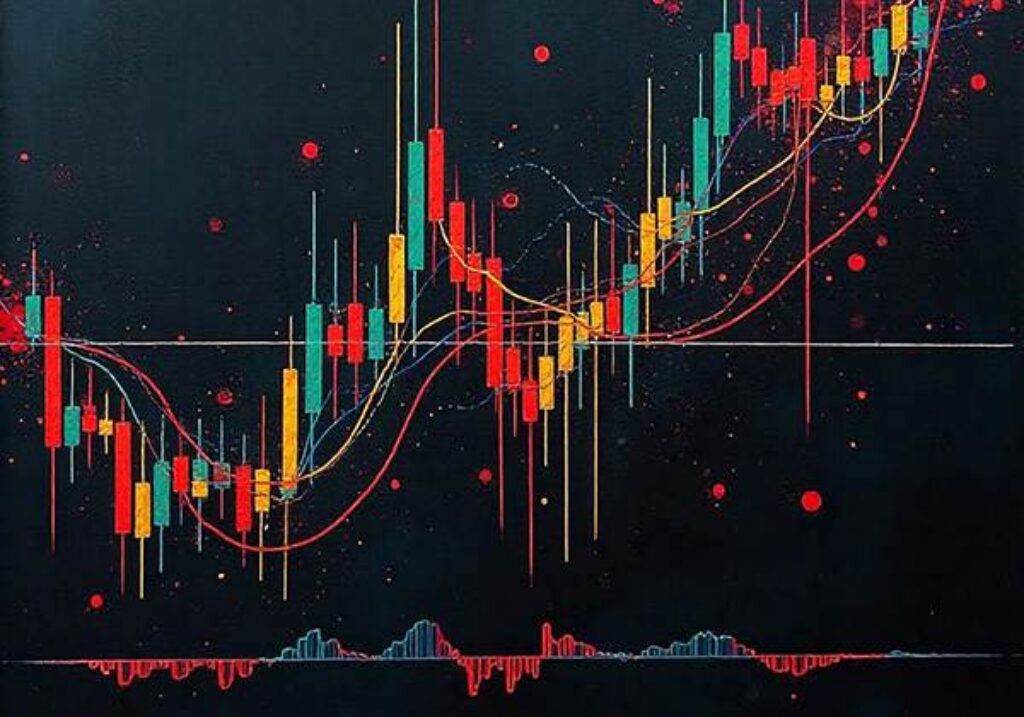
Technical analysis is the study of historical price data and market activity—primarily through the use of charts—to forecast future price movements. Unlike fundamental analysis, which focuses on a company’s earnings, economic indicators, or news events, technical analysis looks purely at the price and volume data available on a chart.
Traders who use technical analysis believe that all available information is already reflected in the current price. This means patterns, trends, and indicators derived from price charts can give insights into future movements.
Technical Analysis vs. Fundamental Analysis
Technical Analysis
Fundamental Analysis
Focuses on price action & charts
Focuses on financial statements & news
Short-term to medium-term orientation
Long-term investment focus
Uses indicators, patterns, and signals
Uses balance sheets, earnings, economic data
Common in forex, crypto, intraday trades
Common in value investing and long positions
While fundamental analysis tries to determine the intrinsic value of an asset, technical analysis is more concerned with market sentiment and how supply and demand drive prices.
Why Do Traders Use Technical Analysis?
Identifying Trends: Trends are the backbone of technical trading. Traders use tools like trendlines and moving averages to determine whether the market is in an uptrend, downtrend, or range.
Finding Entry and Exit Points: Technical tools like support and resistance levels, candlestick patterns, and indicators (like RSI, MACD, and Bollinger Bands) help traders pinpoint optimal buying and selling moments.
Chart Patterns: Patterns such as head and shoulders, double tops, and triangles provide signals about potential reversals or continuations.
Risk Management: Stop-loss levels, position sizing, and price zones derived from chart analysis help traders manage their risks efficiently.
No Need for News: Some traders prefer technical analysis because it allows them to trade without being overwhelmed by constant news and economic data.
Popular Tools in Technical Analysis
Candlestick Patterns: Show market sentiment and possible reversals.
Indicators: Such as Relative Strength Index (RSI), Moving Averages (MA), MACD, and Bollinger Bands.
Chart Patterns: Used to forecast potential price breakouts or breakdowns.
Support & Resistance Zones: Key price levels where buying or selling interest is strong.
Final Thoughts
Whether you’re trading stocks, forex, or crypto, understanding technical analysis is essential. It equips you with the ability to read charts, identify trends, and make informed decisions based on historical price behavior.
While it’s not a guaranteed method of success, combining technical analysis with good risk management can greatly improve your chances in the market. As with any skill, it takes time and practice—but it’s a powerful tool that every trader should have in their toolbox.